This function retrieves and displays the specific information for the tested control unit, including unit type, version numbers and other specifications. The sample Autel Maxisys Elite ECU Information screen displays as below:
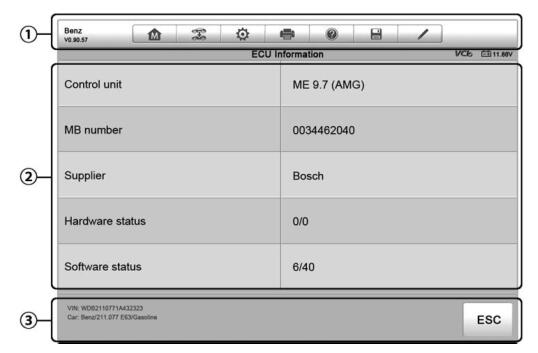
1. Diagnostics Toolbar Buttons – see Table 4-2 Diagnostics Toolbar Buttons on page 33 for detailed descriptions of the operations for each button.
2. Main Section – the left column displays the item names; the right column shows the specifications or descriptions.
3. Functional Button – In this case, only a Back (or sometimes an ESC) button is available; tap it to exit after viewing.
Read Codes
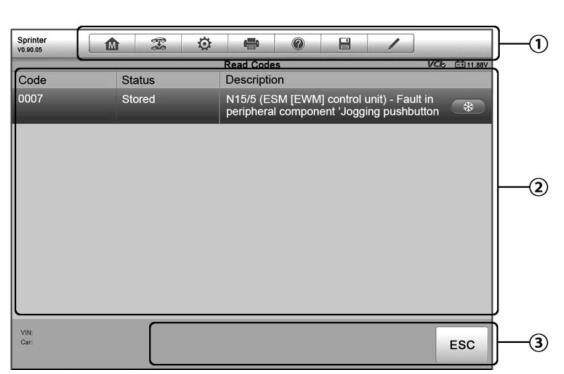
This function retrieves and displays the DTCs from the vehicle’s control system. The Read Codes screen varies for each vehicle being tested, on some vehicles, freeze frame data can also be retrieved for viewing. The sample Read Codes screen displays as below:
1. Diagnostics Toolbar Buttons – see Table 4-2 Diagnostics Toolbar Buttons on page 33 for detailed descriptions of the operations for each button.
2. Main Section
* Code Column – displays the retrieved codes from the vehicle.
* Status Column – indicates the status of the retrieved codes.
* Description Column – detailed descriptions for the retrieved codes.
* Snowflake Icon – only displays when freeze frame data is available for viewing; Selecting displays a data screen, which looks very similar to the Read Codes interface, therefore same operation method may be applied.
Erase Codes
After reading the retrieved codes from the vehicle and certain repairs have been carried out, you can decide to erase the codes from the vehicle using this function. Before performing this function, make sure the vehicle’s ignition key is in the ON (RUN) position with the engine off.
To erase codes
1. Tap Erase Codes from the Function Menu.
2. A warning message displays to inform you of data loss when this function is applied.
a) Tap Yes to continue. A confirming screen displays when the operation is successfully done.
b) Tap No to exit.
3. Tap ESC on the confirming screen to exit Erase Codes.
4. Check the Read Codes function again to ensure the operation is successful.
3. Functional Button – in this case, only a Back (or sometimes an ESC) button is available; tap it to return to the previous screen or exit the function.
Live Data
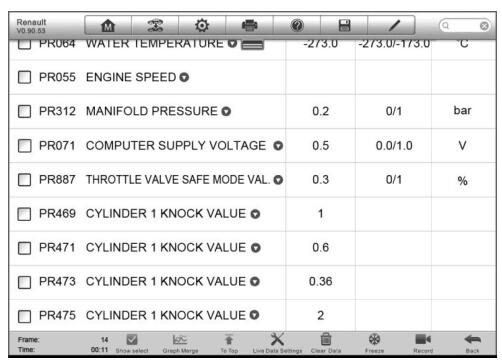
When this function is selected, the screen displays the data list for the selected module. The Autel Scanner available for any control module vary from one vehicle to another. The parameters display in the order that they are transmitted by the ECM, so expect variation between vehicles. Gesture scrolling allows you to quickly move through the data list. Simply touch the screen and drag your finger up or down to reposition the parameters being displayed if the data covers more than one screen. The figure below shows a typical Live Data screen:
1. Diagnostics Toolbar Buttons – tap the drop-down button at the top
center of the screen displays the toolbar buttons. See Table 4-2
Diagnostics Toolbar Buttons on page 33 for detailed descriptions of the
operations for each button.
2. Main Section
* Name Column – this column displays the parameter names.
a) Check Box – tap the check box at the left side of the parameter name to make selection of an item. Tap the check box again to deselect the item.
b) Drop-down Button – tapping the drop-down button at the right side of the parameter name opens a submenu, which provides various choices for data display mode.
* Value Column – displays the values of the parameter items.
* Range Column – displays the minimum and the maximum limit value.
* Unit Column – displays the unit for the parameter values.
* To change the Unit mode, tap the Setting button on the top toolbar and select a required mode. See 7.1.1 Unit on page 77 for more information.
3. Display Mode
There are 4 types of display modes available for data viewing, allowing you to view various types of parameters in the most suitable way for better data check-ups.
Tapping the drop-down button on the right side of the parameter name opens a submenu. There are 4 buttons to configure the data display mode, plus one Help button on the right, tappable when additional information is available for your reference. Each parameter item displays the selected mode independently.
Analog Gauge Mode – displays the parameters in form of an analog meter graph Text Mode – this is the default mode which displays the parameters in texts and shows in list format
NOTE: Reading of status parameters, such as a switch reading, which are mostly in word form, like ON, OFF, ACTIVE, and ABORT, etc., can only be displayed in Text Mode. Whereas reading of value parameters,
such as a sensor reading, can be displayed in text mode and other graph modes.
Waveform Graph Mode – displays the parameters in waveform graphs When displaying this mode, three control buttons will appear on the right side of the parameter item, allowing you to manipulate the display status.
* Text Button – resumes Text Display Mode
* Scale Button – changes the scale values, which are displayed below the waveform graph. There are 4 scales available: x1, x2, x4 and x8.
* Zoom-in Button – tap once to display the selected data graph in full screen
Digital Gauge Mode– displays the parameters in form of a digital gauge graph
Full Screen Display – this option is only available in the waveform graph mode, and mostly used in Graph Merge status for data comparison.
There are three control buttons available on the top right side of the
screen under this mode.
* Edit Button – tapping this button opens an edit window, on which you can set the waveform color and the line thickness displayed for the selected parameter item.
* Scale Button – changes the scale values, which are displayed below the waveform graph. There are 4 scales available: x1, x2,x4 and x8.
* Zoom-out Button – exits full screen display.
* To edit the waveform color and line thickness in a data graph
1. Select 1 to 3 parameter items to display in Waveform Graph mode.
2. Tap the Zoom-in Button on the right to display the data graph in full screen.
3. Tap the Edit Button, an edit window appears.
4. Select a parameter item on the left column.
5. Select a desired sample color from the second column.
6. Select a desired sample line thickness from the right column.
7. Repeat step 4-7 to edit the waveform for each parameter item.
8. Tap Done to save the setting and exit, or tap Cancel to exit without saving.
4. Functional Buttons
The operations of all the available functional buttons on Live Data screen are described below:
Back – returns you to the previous screen or exit the function.
Record – starts recording the retrieved live data; the recorded data is then stored as a video clip in the Data Manager application for future reviews. This function could be triggered automatically at preset threshold value or manually as you choose, and the triggering mode and record duration can be configured in the Setting mode of Live Data.
Freeze – displays the retrieved data in freeze mode.
* Previous Frame – Moves to the previous frame in the freeze data.
* Next Frame – Moves to the next frame in the freeze data.
* Resume – this button appears when the Record or Freeze function is applied. Tapping this button stops data recording, or exit freeze data mode, and resumes normal data display mode.
* Flag – this button appears when the Record function is applied. Tapping this button sets flags for the recorded data at points wherever you choose, when playing back the recorded video clip later in Data Manager, the
preset flag will enable a popup to allow input of text to take notes.
* Clear Data –tapping which clears all previously retrieved parameter values at a cutting point whenever you choose.
* To Top – moves a selected data item to the top of the list.
* Graph Merge – tap this button to merge selected data graphs (for Waveform Graph Mode only). This function is very useful when making comparison for different parameters.
NOTE: This mode supports Graph Merge for 2 to 3 parameter items only, so select no less than 2 or more than 3 items each time when making graph merge.
* To cancel Graph Merge mode, tap the drop-down button on the right side of the parameter name, and select a data display mode. Show Selected/Show All – tap this option to exchange between the two options; one displays the selected parameter items, the other displays all the available items.
Setting – tapping this button opens a setting screen, which allows you to set the trigger mode, recording duration, and various threshold values for data recording, and make other controls.
There are 4 navigation buttons on top of the Setting mode screen.
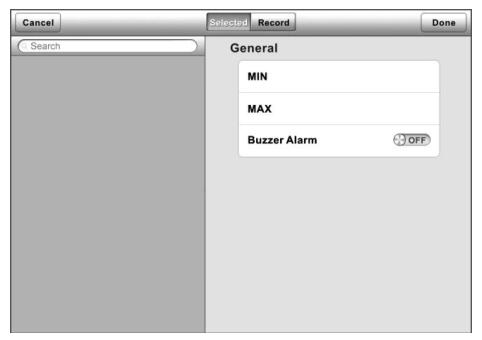
* Range Button – displays the configuration screen on which you can set the threshold values, an upper limit and a lower limit, for triggering the buzzer alarm. This function is only applied to the Waveform Graph display mode.
a) MIN – tapping which opens a virtual keyboard, allows you to enter the required lower limit value
b) MAX – tapping which opens a virtual keyboard, allows you to enter the required upper limit value
c) Buzzer Alarm – switches the alarm on and off. The alarm function makes a beep sound as a reminder whenever the data reading reaches the preset minimum or maximum point
To set threshold limits for the parameter values
1. Tap the Setting functional button at the bottom of the Live Data screen.
2. Tap the Range navigation button.
3. Select a parameter item on the left column, or enter the item name in the Search bar.
4. Tap on the right side of the MIN button, and enter the required minimum value.
5. Tap on the right side of the MAX button, and enter the required maximum value.
6. Tap the ON/OFF button on the right side of the Buzzer Alarm button to turn it on or off.
7. Tap Done to save the setting and return to the Live Data screen; or tap Cancel to exit without saving.
If the threshold limits are successfully set, two horizontal lines now appear on each of the data graphs (when Waveform Graph Mode is applied) to indicate the alarming point. The threshold lines are shown in different colors than the waveform of the parameters for distinction.
* Record Button – displays the configuration screen for Record Setting, on which you can set the trigger type, duration and trigger point for the data recording function.
a) Trigger Type – sets the trigger mode for data recording, mainly of two kinds: Manual and Auto. There are four options available:
1) Manual – allows you to manually start and stop data recording
2) DTC – auto triggers data recording when any DTC is detected
3) DTC Check Mode – auto triggers data recording when certain pre-selected DTC types are detected
4) Parameter – auto triggers data recording when any parameter value reaches the preset threshold
b) Duration – sets the recording time (for Auto trigger mode only)
c) Trigger Point – reserves a relative percentage of a record length before the data recording start point for reference (for Auto trigger mode only)
* To perform setting for live data record
1. Tap the Setting functional button at the bottom of the Live Data screen.
2. Tap the Record navigation button.
3. Tap the ○> button on the right of Trigger Type bar and select the required trigger mode.
4. Tap the ○> button on the right of Duration bar and select a
length of time.
5. Tap the ○> button on the right of Trigger Point bar and select a relative percentage of a record length to be reserved before the data recording start point.
6. Tap Done to save the setting and return to the Live Data screen; or tap Cancel to cancel without saving and exit Setting.
* Done Button – confirms and saves the setting, and returns you to the Live Data screen.
* Cancel Button – cancel the setting operation, and returns you to the Live Data screen
Active Test
The Active Test function is used to access vehicle-specific subsystem and component tests. Available test vary by manufacturer, year, and model, and only the available tests display in the menu. During an active test, the tester outputs commands to the ECU in order to drive the actuators. This test determines the integrity of the system or parts by reading the engine ECU data, or by monitoring the operation of the actuators, such as switching a solenoid, relay, or switch, between two operating states.
Selecting Active Test opens a menu of test options that varies by make and model. Selecting a menu option activates the test. Follow all screen instructions while performing tests. How and what information is presented on the screen varies according to the type of test being performed. Some toggle and variable control tests display Active Test Controls at the top of the screen with data stream information below, or vice versa.
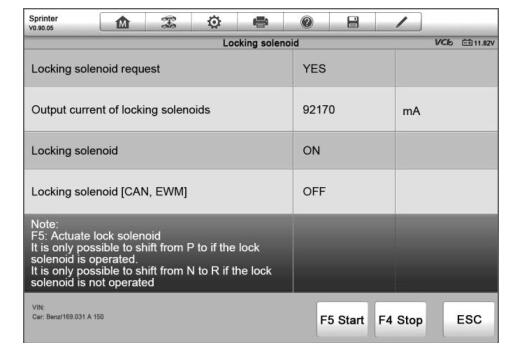
The functional buttons at the lower right corner of the Active Test screen manipulate the test signals. The operational instructions are displayed on the main section of the test screen. Simply follow the on-screen instructions and make appropriate selections to complete the tests. Each time when an operation is successfully executed, message such as ―Command Finished‖,―Activation Successful‖, or something similar displays.
Tap the ESC functional button to exit the test when finished.
This article is publiced by www.obd2tool.com。
Leave a Reply